Lowell FY 2018 Results – Reiterate Sell Recommendation
15 April 2019

high-yield
Lowell FY 2018 Results – Reiterate Sell Recommendation
Rupesh Tailor, Everest Research, 15 April 2019
Summary
- We reiterate our sell recommendation on Lowell’s £ 8.5% senior secured bonds at 94.25 (10.5% YTW, Z+933) and our avoid recommendation on all other Lowell bonds and CDS
- Our updated base, stress and bull valuations (probabilities of 50%, 45% and 5% respectively) on Lowell’s senior secured bonds come out at 48%, 31% and 96% respectively (see our note for methodology) post FY 2018 results, giving an expected value of 43%
- The basic problem we see with Lowell is that, once we take into account its underlying “other operating expenses” (which are hard to separate between its debt purchase, DP, and third party collections, 3PC, businesses), Lowell does not generate enough lifetime cash to sustain its current capital structure (see our note for more). This stems from the quantum of debt taken to finance Permira’s acquisition of the original Lowell part of the business (i.e. the UK part rather than GFKL in Germany). Permira’s acquisition of Lowell (UK) at 112% of (gross) ERC was the first time (and as far as we know only time) a major DP firm acquisition was undertaken on an EV/ERC multiple materially north of 80% for a business with negligible 3PC activity at the time
Key Observations
- Key observation #1 – Lowell reported FY 2018 steady state free cash flow (SS FCF) of £28m (c. 1% of net debt) based off an average Estimated Remaining Collections (ERC) replacement rate1 of £258m. Adjusting for replacement of collections on 2018 portfolio purchases received in 2018 (£89m), we estimate 2018 SS FCF at -£67m (-3% of net debt) compared to -£60m (-4% of net debt) in 2017 on our preferred methodology explained in our note. Adjusting further to remove company-stated exceptional operating expenses, 2018 SS FCF improves to -£22m (-1% of net debt) compared to -£26m (-2% of net debt) in 2017
- In our note we show that one year SS FCF (aggregated over time for a static pool of portfolios) bears very little resemblance to the net lifetime cash generation of that pool owing to the possibility whereby even portfolios that would be loss-making on a lifetime basis relative to price paid (even before collection activity costs and a share of central costs) will be Adj EBITDA and SS FCF positive early in their life as long as the cost-to-collect ratio is < 100%. We believe Adj EBITDA and SS FCF have little to no value as analytical measures for debt purchasers and that investors should focus instead on net lifetime cash generation
- Our preferred method for estimating (the still overstated in our view) SS FCF operates as follows for 2018. We see 2018 actual FCF excluding M&A and change in working capital and before dividends and portfolio purchases at £200m, which we uplift by £23m to pro forma this for the acquisition of the Nordic Carve-Out acquisition. We estimate the 2018 ERC replacement rate1 as [end 2018 Year 1 ERC - end 2018 Tail Year ERC + 2018 collections taken on portfolios purchased in 2018] divided by a gross money multiple2 (GMM) of 1.9x (in line with Lowell's stated purchasing multiple in 2018 including its secured portfolio purchases). We estimate the average ERC replacement rate1 (£291m) by averaging the end 2018 ERC replacement rate (£341m) with the end 2017 ERC replacement rate (£241m), both calculated using the same methodology. Our 2018 SS FCF estimate is then the £200m actual FCF excluding M&A and change in working capital before dividends and portfolio purchases plus the £23m pro forma adjustment for the Nordic Carve-Out acquisition less the £291m average ERC replacement rate1, giving -£67m versus Lowell's own estimate of £28m
- Management stated on the call that they see their own estimate of SS FCF as an understatement owing to three factors. First, is the collections lag on new portfolio purchases in 2018. Lowell made £408m of portfolio purchases in 2018 which, at the stated 1.9x GMM, gives £775m of ERC. From this ERC addition, Lowell collected only £89m in 2018, whereas its full “year 1” ERC thereof was £180m, suggesting a collections lag of £91m and boost to SS FCF of £70m at the 2018 DP cost-to-collect ratio of c. 23%
- Second, is that collection activity costs would be lower in a steady state, both because Lowell’s blended lifetime cost-to-collect ratio for its DP business would be c. 18.5%2 rather than the actual c. 23% in 2018 and because the collection activity costs on the “growth” investment in portfolio purchases (£408m purchases vs £258m ERC replacement rate according to company disclosure) would not have been incurred. Adjusting the DP cost-to-collect ratio down to Lowell’s stated lifetime cost-to-collect ratio generates an improvement in 2018 SS FCF of c. £30m on our estimates. We would not exclude the additional collection activity costs on “growth” portfolio purchases from SS FCF because the collections benefit of these growth portfolio purchases has been partly taken in 2018
- Third, Lowell views its own ERC replacement rate estimate as overstated as the GMM on which this is estimated is the low GMM at pricing compared to the consistent GMM uplifts Lowell experiences as a portfolio purchase vintage matures. For instance, using a GMM of 2.3x for both 2017 and 2018 purchases (compared to the more mature 2015 and 2016 vintages where GMMs have expanded from 1.9x at pricing to 2.4x and 2.3x respectively) gives a 2018 average ERC replacement of c. £230m using the company’s methodology, which increases 2018 SS FCF by c. £28m. In total, the above illustrative SS FCF adjustments for 2018 would put SS FCF on the company’s methodology at c. +£128m or c. 6% of net debt
- In our note, we look at data evidence for any material collections lag, reduction in cost-to-collect ratio as portfolios mature and potential for GMM uplifts from today’s ERC estimates. In particular, we find no evidence of persistent understatement of Adj EBITDA due to time lags in collections on newly purchased portfolios when we compare Lowell’s total expenses-to-collections ratio with growth in portfolio carrying value (we do this also going back for Lowell’s UK business prior to its acquisition by Permira). Logically we have some sympathy with the company’s view that, for a purchaser of predominantly non-paying portfolios, it would take some time and cost to convert non-payers into payers. However, we see no compelling evidence in the data for this – if true, we would expect Lowell’s total expenses-to-collections ratio to increase in periods where it is growing its portfolio carrying value more rapidly (as costs increase more than collections initially) but our findings do not show this
- Key observation # 2 - Our estimate of Lowell's all-in net IRR (i.e. after collection activity costs and an allocation for central costs) on its in-force portfolios improved to 10% at 2018 from 9% at 2017 (see our recent note for details). This is above Lowell's weighted average cost of debt at 6.3%, albeit Lowell's debt maturity profile is relatively short and we project the all-in net in-force IRR to decline to 7% in 2019 should current purchasing economics persist and purchasing volumes modestly grow as guided by Lowell
- The improvement in Lowell’s all-in net IRR in 2018 is mainly due to a reduction in underlying other expenses relative to DP collections from 17% in 2017 to 12% in 2018 (and 13% at H1 2018), a positive sign of some operating leverage starting to show through (we look at evidence for operating leverage in our note). Our updated all-in net IRR estimate for 2018 also reflects Lowell’s more granular lifetime cost-to-collect ratio guidance for UK non-paying, UK paying, DACH and Nordics portfolios provided with the 2018 results, though on a blended basis at 18.5% this is almost identical to what we had previously assumed
- Management remains positive on the outlook for positive net IRR (pre-central costs allocation) progression going forward. Company-disclosed net IRR on 2018 portfolio purchases was 16% (compared to our estimate of c. 13% on all in-force portfolios owned at end 2018 before central costs allocation)
- Key observation #3 – Lowell reported a gross money multiple (GMM)2 of 1.9x on new portfolio purchases in 2018 (compared to 2.1x on new purchases in 2017 though this is not like-for-like as 2017 excluded the Nordic Carve-Out business where GMMs are lower). Excluding £88m of UK paying portfolios purchased in 2018, Lowell’s 2018 GMM would have been 2.1x
- Most positively, Lowell provided evidence of GMM uplifts (since pricing) for some of the more recent vintages. For instance, for the 2015 and 2016 vintages, GMMs have expanded from 1.9x at pricing to 2.4x and 2.3x respectively (but only from 2.0x to 2.1x for the 2017 vintage). As per our note, we see Arrow and Lowell as the outlier firms amongst debt purchasers in terms of largest cumulative positive ERC and portfolio carrying value revaluations (excluding ERC tail year roll-in) over the past 5 years and hence the least likely to be able to sustain GMM uplifts going forward as their ERC assumptions already incorporate more of the collections outperformance benefits of recent years
- Key observation #4 – Lowell’s net portfolio carrying value write-up was +£58m in Q4 2018 compared to a quarterly range of +£11m to +£34m since Lowell was bought by Permira in 2015. Whilst this figure includes roll-in of the ERC tail which generally increases as Lowell’s ERC grows, we note that the reason for the uplift in Q4 versus Q3 2018 was due to the 2018 actual to estimated collections coming in at 103% vs 101% at 9m 2018, highlighting how current period collections outperformance (vs estimates) gets extrapolated through the ERC horizon, more so at Lowell and Arrow than at other debt purchasers as per our note
- Key observation #5 – Management stated on the call that it expects to move to an all secured capital structure over the longer term, supported by its new leverage target of 3.5 – 4.0x by 2021/2022 (from 5.1x at 2018 of which 4.1x through secured debt). Clearly, if achieved, this would be most supportive of Lowell’s bottom-ranking £ 11% 2023 bond (and CDS referencing it)
- Lowell’s new leverage target was stated by the company to be in addition to its previous guidance of 4.5x by mid 2020 and that the deleveraging would be achieved through EBITDA growth. Lowell also guided to modest growth in portfolio purchasing in 2019, similar to the c. 5% organic growth in 2018
- Unfortunately, we view it as highly unlikely that Lowell will achieve this leverage target. Whilst Lowell can almost always guarantee Adj EBITDA growth just by purchasing sufficient new portfolios (see our note), without a significant improvement in all-in net IRRs, Lowell cannot sustain sufficient growth in new portfolio purchases without significant debt financing, i.e. Lowell can grow Adj EBITDA but only through taking on more debt financing to buy new portfolios on our estimates
- Only in our bull model (to which we assign a 5% probability) do we see Lowell achieving 4.0x net leverage in 2022. The key assumptions here are portfolio purchases of £450m in each of 2019 – 2021 (compared to £408m in 2018); blended GMM rising to 2.4x at pricing in 2020 (compared to 1.9x in 2018); actual : estimated collections of 103% in each year on both the in-force portfolios and on new portfolios purchased over 2019 – 2022, i.e. collections outperformance compounds at 3% per year; DP cost-to-collect ratio (excluding central costs) falling to 19% (from 23% in 2018); and underlying central cost annual inflation of 1% with no “non-recurring” exceptional expenses
- These bull model assumptions result in Adj EBITDA increasing from £413m in 2018 (not pro forma) to £604m in 2022, which can be funded with the end 2018 amount of bond debt (some of which falls due by 2022) together with the £255m securitisation facility (which Lowell’s lenders have agreed to reset to £255m over the next 18 months – the facility would otherwise be amortising) plus £200m of drawings on the EUR 455m RCF
- We think the biggest challenges to Lowell achieving our bull model trajectory are: 1. achieving GMMs of 2.4x on new portfolio purchases at pricing AND compounding both front book and back book GMM at actual : estimated collections of 103% each year; and 2. Reducing DP cost-to-collect ratio to 19% on what remains a rapidly growing non-paying book. We think (1) requires significant purchasing capacity to be taken out of the DP market (which we view as only occurring through large-scale DP firm failures in a downturn); and (2) requires c. 40% of all collections to be generated through digital self-service (see our note)
- Key observation #6 – Positively for Lowell, we see some early signs of operating leverage if we assume the exceptional other operating expenses are non-recurring. The share of underlying other operating expenses which we allocate to the DP business has fallen from 17% in 2017 to 12% in 2018
- New CEO in-waiting, Colin Storrar, spoke confidently on the results call about being able to extract operating leverage through both collection activity costs and other operating expenses. We will watch closely for signs of progress here – our analysis of operating leverage across the debt purchaser space (see here) broadly shows little progress other than at Intrum and, more recently, at Cabot
• Key observation #7 – Lowell believes its growth to 2022 can be funded within its existing RCF and securitisation facilities, with no need to come back to the high yield bond market (presumably until closer to its bond debt maturities). This is consistent with all of our base, stress and bull models. In the bull model, this “quasi self-funding” occurs because all-in net IRRs improve (significantly); in our stress model because Lowell cuts back on portfolios purchased (significantly); whilst in our base model, Lowell utilises nearly all its RCF (£354 drawn) by 2022
- In terms of liquidity, Lowell disclosed available liquidity at end 2018 of £442m (comprising unrestricted cash of £71m and the remainder undrawn under the RCF). The announced reset of Lowell’s securitisation facility to £255m in the next 18 months is also supportive of liquidity, taking away some of the amortisation pressure on that facility
- Lowell did not disclose the entirety of its future year forward flow agreement (FFA) committed portfolio purchases, but did disclose c. £210m for 2019 including purchases already made under those FFAs
- Key observation #8 – Lowell’s (IFRS 9-based) stress-testing shows no significant correlation between macro variables and its collections: “Business model analysis, contract review and segmented, detailed correlation and causation testing were undertaken at a regional level, in conjunction with a third party specialist. As a result of this analysis, no correlation between the macro economic factors and future collections performance was identified. This outcome is in line with management’s expectations given the nature of the Group’s existing portfolio investments is underpinned by predominantly non-paying accounts. As part of the extensive correlation and causation testing, the following macroeconomic variables were assessed; unemployment, disposable income, household indebtedness, inflation and other factors.”
- As per our note, one of the two key variables in ERC modelling, namely the quarterly breakage rate (i.e. “re-default rate” on payment plans) has fallen at Lowell UK from c. 28% in 2008 to c. 6% in 2017 (when it was last disclosed), albeit on a like-for-like definition the fall is to c. 12% on our estimates. This fall occurred during a period of improved UK macro (at least relative to 2008). Whether this is due to improved macro or reflects more sustainable setting of payment plans is an open question, though we err on the side of the former for reasons explained in our note
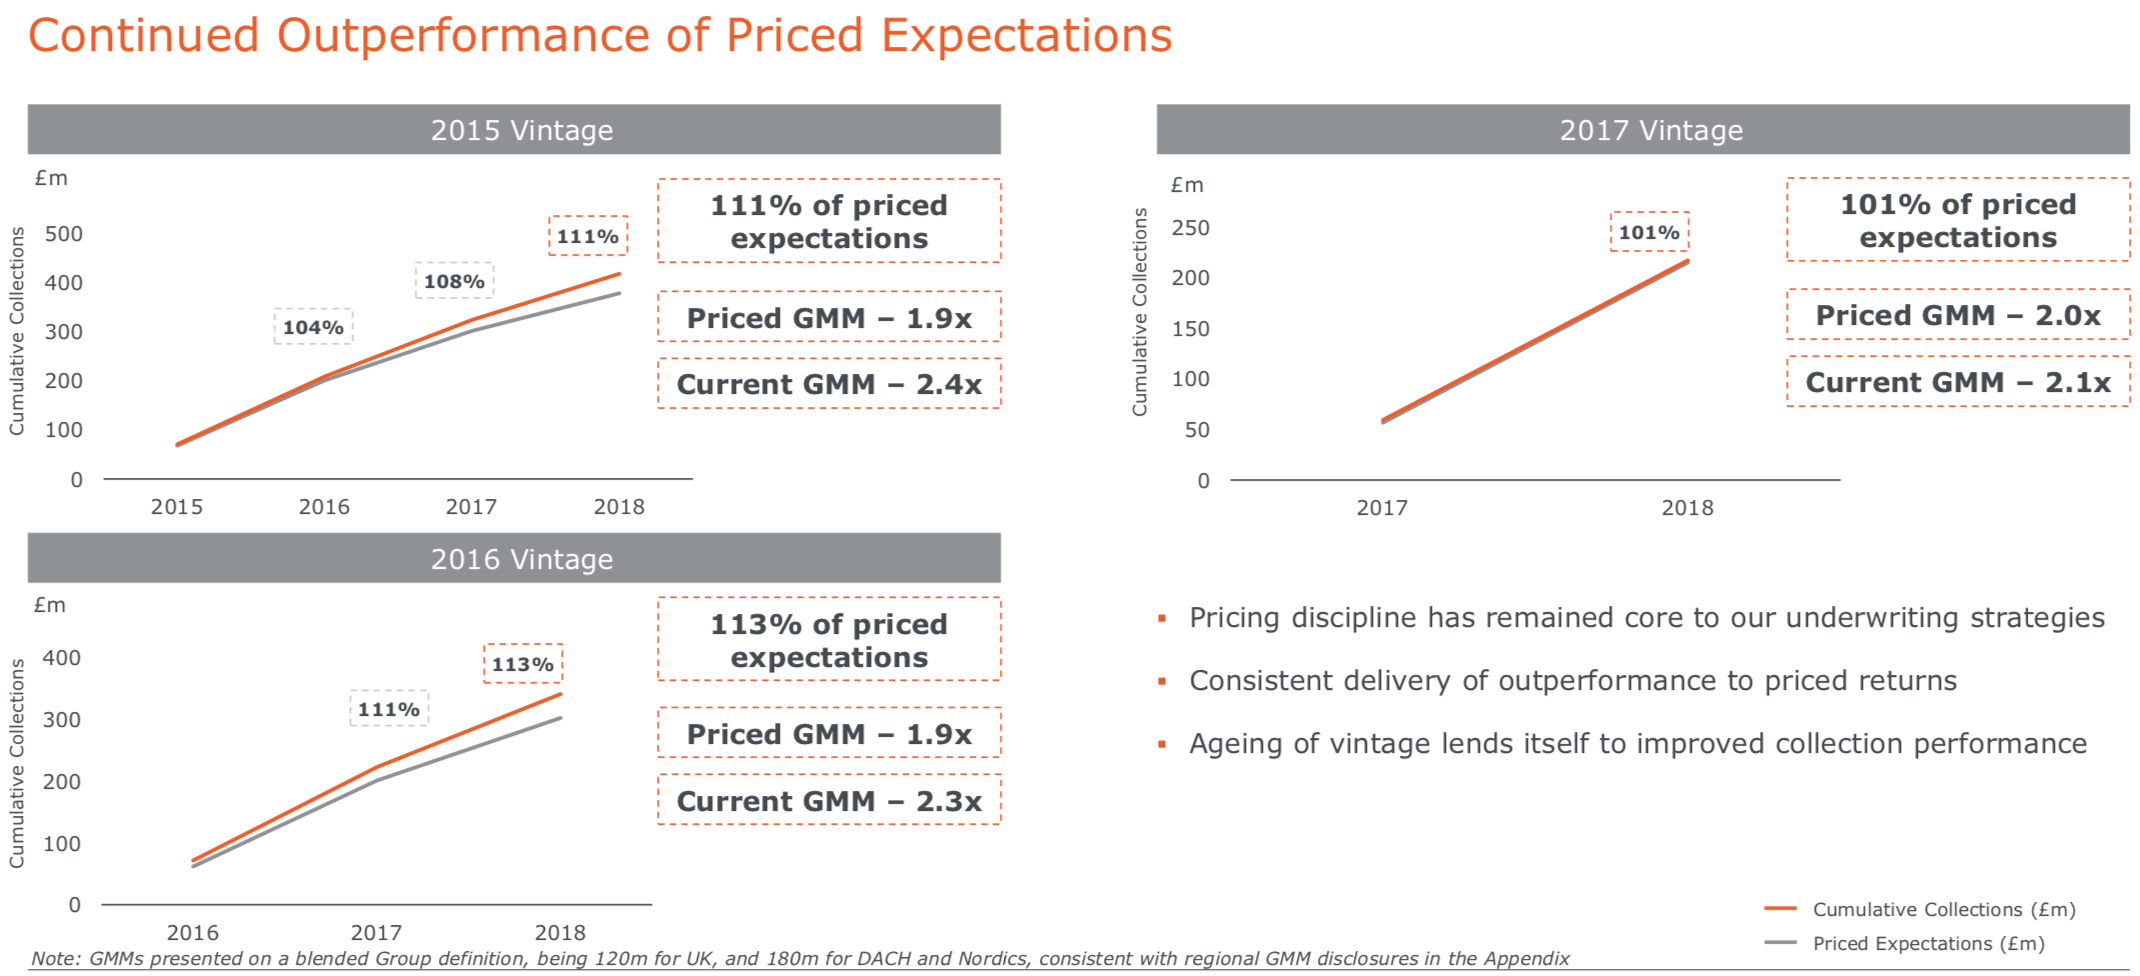
- Key observation #9 – Management went to length to emphasise the accuracy of their collections forecasting and modest outperformance thereof, including for more recent vintages. As per the charts below, Lowell has been able to outperform its collections estimates from the time of pricing by 111%, 113% and 101% for the 2015, 2016 and 2017 vintages respectively
- Whilst positive, we believe this historic outperformance is substantially assumed across Lowell’s ERC curve as Lowell and Arrow have taken the largest positive ERC and portfolio carrying value revaluations over the past 5 years amongst our 11 company debt purchaser coverage universe
- Lowell also illustrated its forecasting accuracy in its ERC tail by disclosing £43m of collections in 2018 from portfolios over 10 years old, 110% of forecast collections on those portfolios as at end 2017
- Key observation #10 – Our understanding from the results call is that, as of the results date, Lowell has not purchased any of its own bonds. In our note, we look at capital allocation going forward for debt purchasers between purchasing portfolios, repaying debt / buying back bonds or purchasing equity in the case of listed firms
- Key observation #11 – We cannot reconcile Lowell’s disclosed c. 23% DP cost-to-collect ratio and c. 60% 3PC cost-to-collect ratio in 2018 with its total 2018 collection activity costs. 2018 DP collections were £661m, on which a 23% DP cost-to-collect ratio generates collection activity costs of £152m. 3PC 2018 PF cash income was £178m, on which a cost-to-collect of 60% generates collection activity costs of £107m, which gives total collection activity costs of £259m in 2018 compared to the statutory reported £300m. This matters for future modelling as we give Lowell the benefit of taking its disclosed cost modelling information at face value. The difference may be down to any pro forma adjustments Lowell is making or in terms of treatment of lawyer service revenue and costs
- Key observation #12 – James Cornell is stepping down as CEO and Colin Storrar (currently CFO) has been appointed as the new CEO. Whilst we have heard some market participants interpreting the exits of long-standing industry management (e.g. Rob Memmott, Arrow Global’s former CFO; Erik Forsberg, Intrum’s former CFO; and now James Cornell) as a negative signal that management who have presided over an industry boom are jumping ship as the outlook for the industry has become more mixed, we do not think this should be interpreted in this way
- James has been at the forefront of the industry’s development since its early days and a true advocate for fair consumer treatment. The business growth he has presided over at Lowell is immense. We wish him well in his life post Lowell. Colin’s knowledge of and passion for the Lowell business and credit management services industry are also exemplary. We believe the management transition will be a seamless one and we wish Colin well in his new role
Results Highlights
| METRIC (£ M) | 2018 | 2017 | % CHANGE | COMMENT |
| DP Collections | 661 | 481 | +37% |
|
| PF Cash Income | 874 | 809 | +8% |
|
| Revenue | 678 | 517 | +25% |
|
| PF Adj EBITDA | 437 | 397 | +10% |
|
| PF Steady State (SS) FCF | 28 | 37 | -24% |
|
| PF Net debt / Adj EBITDA | 5.1x | 5.2x | -0.1x | |
| Portfolio carrying value | 1,561 | 964 | +62% |
|
| 120m ERC | 3,118 | 2,058 | +52% |
|
| Gross money multiple on new portfolio purchases | 1.9x | 2.1x | -0.2x |
|
Contact Rupesh Tailor at Everest Research to discuss: [email protected]
- Lowell measures its ERC replacement rate based on 120m ERC for the UK and 180m for DACH and Nordics. Its tail ERC which rolls in for measuring ERC replacement rate is year 11 for the UK and year 16 for DACH and Nordics
- Lowell similarly measures its gross money multiple (GMM) based on 120m ERC for the UK and 180m for DACH and Nordics
Everest Research - Deep dive high yield research, distressed debt research and independent equity research